
Most sales reports look precise and still miss the truth. Average B2B quota attainment was reported at 43% in 2026, down from 63% in 2019 according to this sales quota attainment benchmark summary, yet many leadership dashboards still celebrate activity spikes, bloated pipeline, and forecast categories that never convert.
That gap matters because a dashboard can make a weak sales motion look healthy for a full quarter. The problem usually isn't a lack of charts. It's that too many teams track numbers that describe motion, not progress, and very few tie those numbers to a specific manager action.
The right sales performance metrics should answer a hard operational question. Is the team talking to enough real buyers. Are deals advancing cleanly. Are reps converting at the right stages. Are the strongest sellers carrying results that the rest of the team can't repeat. If a metric can't trigger a coaching move, a process fix, or a forecast correction, it belongs in a vanity deck, not an operating review.
Why Most Sales Performance Reports Miss What Matters
The first mistake is simple. Teams confuse activity with traction.
A rep can log calls, emails, demos, and follow-ups all week and still create garbage pipeline. Modern KPI frameworks group sales performance metrics into quantity, quality, efficiency, and productivity for exactly this reason. Activity alone doesn't explain conversion quality or revenue output, which is why teams increasingly track multiple indicators together rather than relying on a single number, as outlined in this sales KPI framework.
Activity inflation hides weak deal quality
Most dashboards reward what's easy to count. Calls made. Emails sent. Meetings booked. Those numbers have value, but they become dangerous when leaders read them without asking whether the activity is producing qualified opportunities that move.
A quarterly review often shows this pattern. Outreach is up. Meetings are up. The top of funnel looks busy. Then the team misses commit because those meetings came from weak-fit accounts, low-authority contacts, or deals that never had a real next step.
Practical rule: If activity rises while stage conversion stalls, the team doesn't have a volume problem. It has a qualification problem.
Pipeline coverage often overstates reality
The second flaw is inflated pipeline coverage. On paper, a team can appear fully covered for the quarter while half the late-stage deals are already slipping in practice. CRM stages don't always reflect buyer reality. Forecast calls often inherit stale close dates, duplicated opportunity value, and “best case” deals that are really next-quarter deals wearing this-quarter labels.
Coverage only matters if the opportunities are current, closeable, and stage-accurate. Otherwise leadership is multiplying bad assumptions.
Average win rate can hide a broken team shape
The third flaw is overreliance on averages. A team-level win rate can look respectable even when a handful of strong reps are doing nearly all the work. That distortion is getting worse, not better. Ebsta's 2025 GTM benchmarks found that 14% of sellers drove over 80% of new revenue, top performers closed deals 11 times faster than lower performers, and 78% of sellers missed quota in 2025 in Ebsta's benchmark release.
That's why a useful sales report has to separate four things: how much pipeline exists, how good it is, how efficiently it moves, and how much revenue each rep produces. Anything less creates a dashboard that looks organized while the forecast drifts underneath it.
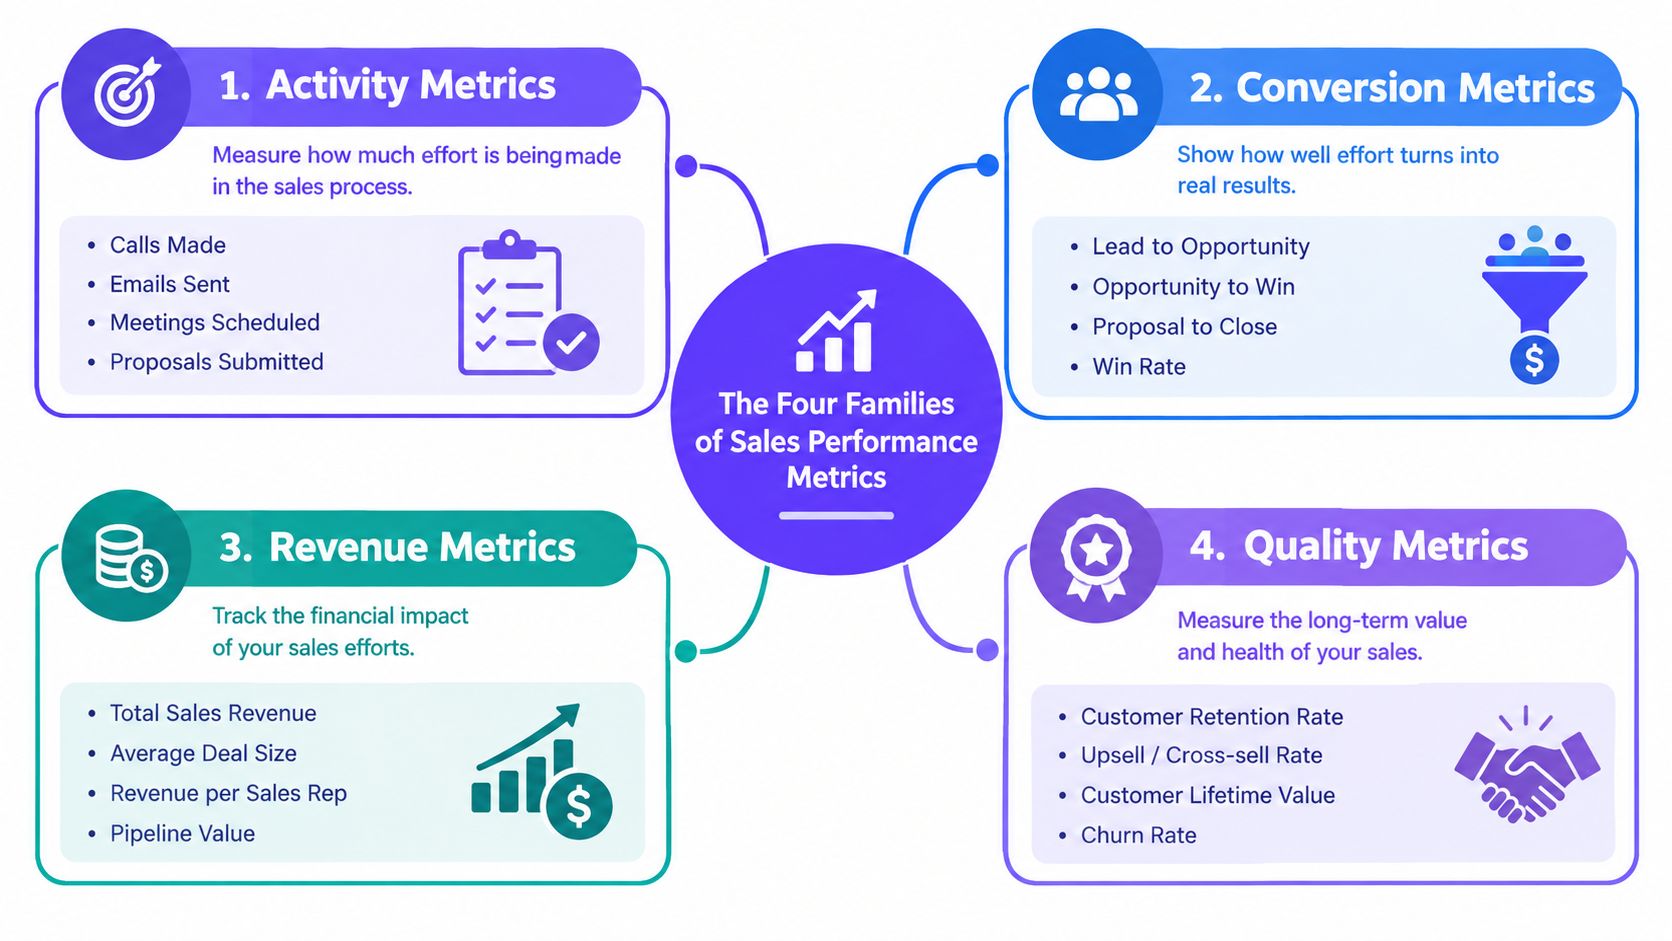
The Four Families of Sales Performance Metrics
Sales leaders don't need more metrics. They need a cleaner map.
The most useful sales performance metrics fall into four families. Keep all four on one page. If one family is missing, leadership is flying blind in a specific way.
Quantity measures whether enough real selling is happening
Quantity metrics track pipeline volume and account coverage. They answer a basic question: is the team creating enough at-bats with the right buyers.
Representative KPI: new opportunities created
This family matters most when teams complain about conversion but haven't built enough pipeline to support the number.
Quality shows whether the pipeline deserves trust
Quality metrics tell leaders whether opportunities are legitimate. They include win rate, deal slippage patterns, qualification quality, and stage hygiene.
Representative KPI: win rate by segment
A pipeline can be large and still be weak. Quality metrics expose whether reps are putting real buyer intent into the system or just preserving optimism.
Efficiency reveals where time is leaking
Efficiency metrics track movement through the funnel. Sales cycle length, lead response time, stage-to-stage conversion, and forecast accuracy belong here.
Representative KPI: sales cycle length
This family matters because flat pipeline snapshots hide drag. Leaders who want to analyze benchmarking data effectively usually need to compare speed and conversion together, not in isolation.
Productivity connects effort to revenue output
Productivity metrics show what the team gets back from its selling capacity. Revenue per rep, pipeline per rep, and output per selling hour sit here.
Representative KPI: revenue per rep
This is the family that stops a team from celebrating busy calendars with weak commercial output.
Why these families have to be read together
One family on its own creates false confidence.
- Quantity without quality fills the CRM with junk.
- Quality without efficiency creates good deals that still close too slowly.
- Efficiency without productivity can make a team look fast while output stays soft.
- Productivity without quantity detail can hide overdependence on a small group of reps.
A practical way to organize a leadership scorecard is to give each family one primary KPI and one diagnostic KPI. Teams building a tighter enablement view can also borrow ideas from these sales enablement KPIs for 2026, especially when the goal is to connect manager coaching with revenue outcomes.
Core Output Metrics That Define Quota Attainment
Quota misses rarely come as a surprise. The surprise is how often leadership reports still make them look sudden.
If your output metrics look healthy while the number is at risk, your definitions are loose, your CRM is carrying fiction, or your team is reading scoreboards instead of operating signals. Four metrics belong in every revenue review because they answer the board's question fast: quota attainment, win rate, pipeline coverage, and average deal size. Then they need to be translated into manager action.
Start with quota attainment, then force a diagnosis
Quota attainment is the bluntest output metric in sales. It shows how much target a rep, team, or region delivered in a set period.
Formula: Closed revenue / Quota
Use it first because it removes narrative. A miss is a miss.
Earlier in the article, the quota benchmark data made the point clearly enough. The useful move here is not repeating the stat. It is deciding what a miss means operationally. If quota attainment is low, leaders should sort reps into three buckets immediately: reps with too little qualified pipeline, reps with enough pipeline but poor close conversion, and reps with viable deals that are slipping past the commit window. Those are three different problems, and they need three different coaching plans.
Quota attainment is the outcome. It should trigger inspection, not debate.
Win rate only matters if you split it by selling motion
Win rate gets abused more than almost any sales metric because teams blend unlike deals into one neat percentage.
Formula: Closed-won deals / Total closed deals
Segment it by deal size, segment, source, and rep tier. Otherwise you will hide the issue. A commercial team can post an acceptable blended win rate while enterprise deals collapse. A strong inbound motion can also mask weak outbound execution. The coaching action is straightforward. Low win rate in one segment points to poor qualification, weak discovery, bad stakeholder mapping, or pricing pressure in that motion. Review lost reasons, call quality, and stage exit criteria for that segment only.
Pipeline coverage is useful only if the pipeline is trustworthy
Pipeline coverage should answer one question: is there enough real opportunity value to support the target?
Formula: Qualified pipeline / Quota
Plenty of teams report a comforting coverage multiple while carrying dead opportunities, invented close dates, and late-stage deals that have not had buyer engagement in weeks. That is dashboard theater. Treat coverage as valid only when the pipeline has current activity, credible stage placement, and close dates that survive manager inspection. If coverage looks fine but attainment is weak, audit opportunity hygiene before you tell reps to create more pipeline.
This is also where scorecard design matters. A clean operating review or a simple sales leaderboard template for weekly revenue reviews helps managers apply the same rules every week instead of changing definitions when the quarter gets tight.
Average deal size can hide weakness just as easily as it can show progress
Average deal size helps you understand the value of each win. It does not tell you whether the motion is getting stronger.
Formula: Closed-won revenue / Number of closed-won deals
A rising average deal size can come from a few oversized wins while core volume softens underneath. A falling average can signal discounting, weaker packaging discipline, poor ICP fit, or rep behavior that favors easier small deals over harder strategic ones. The right management move is to compare average deal size against win rate and segment mix, then decide whether the team is selling better or just selling differently.
Leaders building targets and review rhythms can tie these outputs to commercial OKR examples so quota metrics drive operating behavior instead of sitting in a quarterly recap.
Core Output Metric Formulas and How to Read Them
| Metric | Formula | What good leaders ask next |
|---|---|---|
| Quota attainment | Closed revenue / Quota | Is the gap coming from pipeline volume, conversion quality, or deal slippage? |
| Win rate | Closed-won deals / Total closed deals | Which segment, source, or rep tier is pulling the number down? |
| Pipeline coverage | Qualified pipeline / Quota | Are these opportunities current, correctly staged, and likely to close this period? |
| Average deal size | Closed-won revenue / Number of closed-won deals | Is value shifting because of ICP mix, discounting, packaging, or rep behavior? |
These four metrics define output. They do not explain root cause on their own. That is exactly why leaders need to treat each one as the start of a coaching decision, not the end of the analysis.
Process and Speed Metrics That Expose Hidden Friction
Output metrics tell leaders what happened after the quarter was already shaped. Process and speed metrics show where the quarter started to go wrong.
The most useful ones are sales cycle length, lead response time, forecast accuracy, stage conversion velocity, time-in-stage outliers, and late-stage slip patterns. None of these should sit in a dashboard as passive reporting. Each one should trigger an investigation.
Cycle length reveals where buyers are getting stuck
Sales cycle length should be measured from first qualified touch to closed-won, then segmented by deal size and motion.
Formula: Close date minus first qualified date
A healthy number isn't universal. It should stay consistent within a segment. If enterprise cycles stretch while commercial stays flat, leadership likely has a deal execution issue in discovery, security review, procurement, or legal.
Response time and forecast accuracy expose discipline
Lead response time should be reviewed as a median, not an average, because a few extreme delays can distort the picture.
Formula: Time of first outbound response minus inbound creation time
Fast teams don't leave inbound sitting untouched. Slow response usually points to routing problems, weak ownership, or poor rep discipline.
Forecast accuracy compares predicted closed revenue with actual closed revenue inside the same quarter.
Formula: Forecasted revenue compared with actual closed revenue
If commit is routinely inflated, the issue usually isn't optimism alone. It's stage criteria, deal inspection quality, or manager reluctance to remove risk from the call.
The forecast breaks long before the spreadsheet breaks. It breaks when reps advance deals they haven't actually validated.
Friction shows up in the handoffs between stages
Stage-to-stage conversion velocity often says more than top-line pipeline. A healthy funnel doesn't just contain deals. It moves them cleanly. If a large share of opportunities stall in one stage, managers should inspect a small sample of real opportunities, not the aggregate chart, and look for missing buyer commitments, weak next steps, or internal blockers.
Process and Speed Metrics Formulas and Healthy Benchmarks
| Metric | Formula | Healthy Benchmark | What It Exposes |
|---|---|---|---|
| Sales cycle length | Close date minus first qualified date | Stable within each segment and motion | Deal complexity, legal drag, weak discovery, poor qualification |
| Lead response time | First outbound timestamp minus inbound timestamp | Fast enough that inbound interest doesn't go cold | Routing delays, weak ownership, slow top-of-funnel follow-up |
| Forecast accuracy | Forecasted revenue compared with actual closed revenue | Tight enough that commit means something | Weak stage criteria, manager optimism, poor inspection discipline |
| Stage-to-stage conversion velocity | Time and conversion from one stage to the next | Consistent movement across comparable deals | Handoff friction, stalled demos, weak next-step control |
| Time in stage | Days an opportunity remains in a specific stage | No aging pockets that repeatedly build up | Stalled deals, unclear exit criteria, buyer inactivity |
| Late-stage slippage | Count or share of late-stage deals pushed out | Limited repeat slippage across consecutive reviews | Fake urgency, shaky close dates, discount-led delay |
Connecting Metrics to Rep-Level Coaching and Assessment
A dashboard doesn't coach anyone. Managers coach reps. Metrics just tell them where to start.
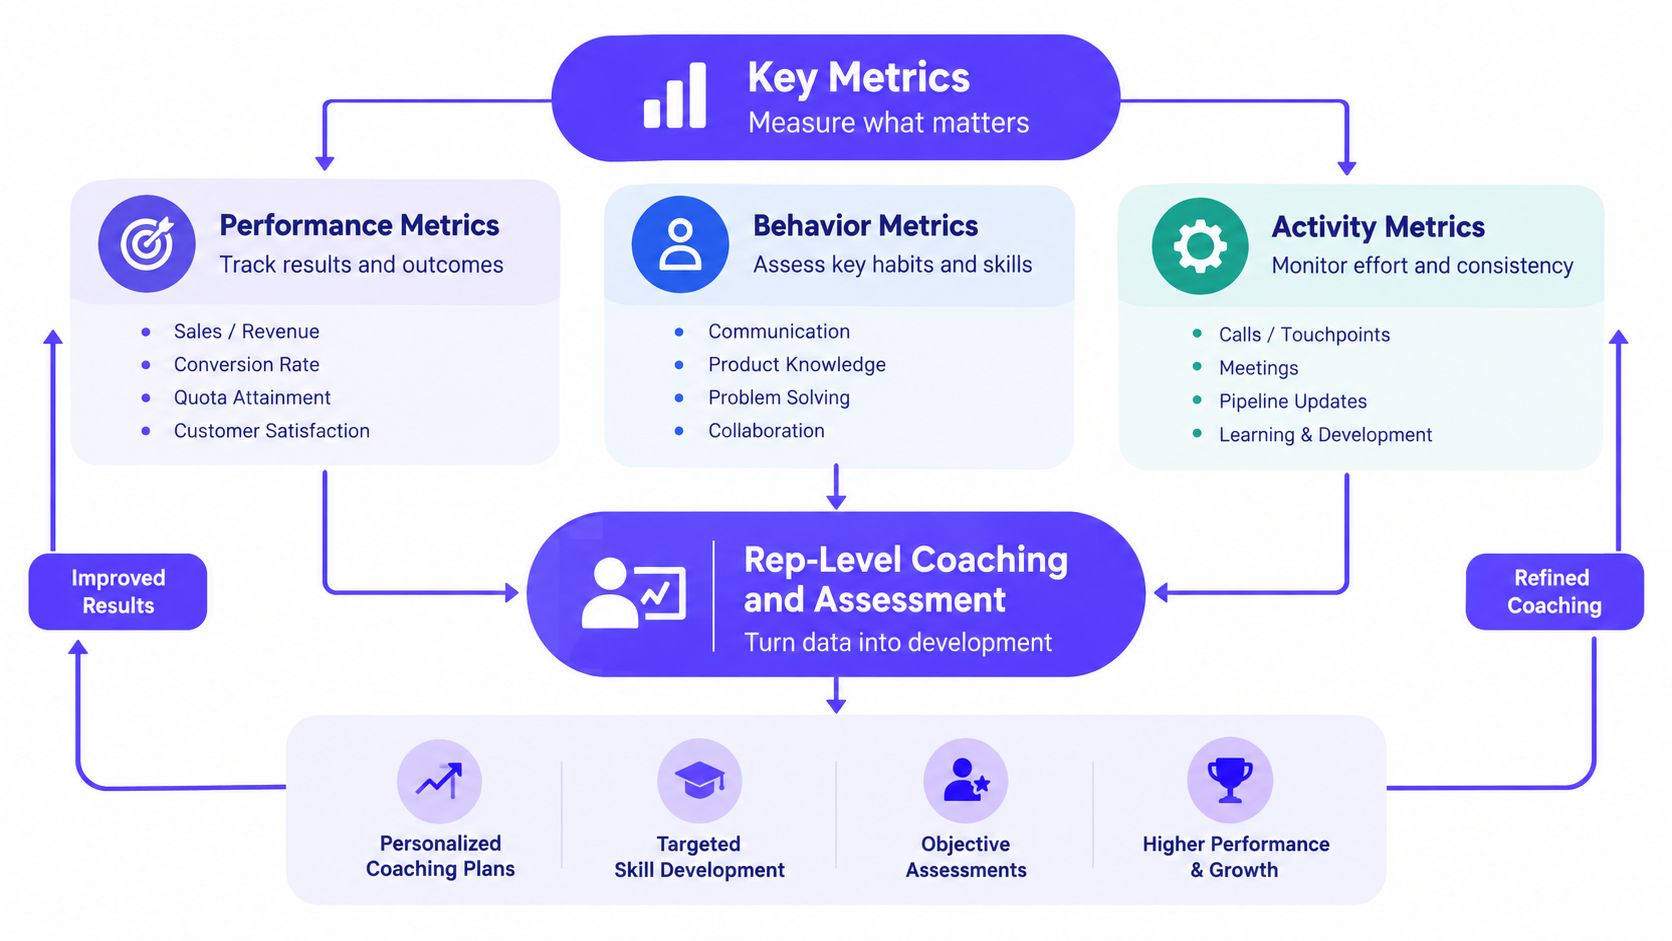
The strongest coaching systems use three layers: results, behaviors, and proficiency. Read in that order, they keep managers from guessing. Read together, they make it easier to decide whether a rep has a skill gap, an execution gap, or a territory and market challenge.
Result metrics confirm the problem
Result metrics include quota attainment, win rate, and average deal size. These numbers tell a manager whether the rep is producing. They are lagging indicators, but they still matter because they prevent coaching sessions from drifting into opinion.
A rep who misses quota with normal deal size but weak win rate needs a different intervention from a rep who closes often but only at low values.
Behavior metrics show what the rep is doing
Behavior metrics sit closer to daily execution. Discovery-to-demo ratio. Multi-threading by opportunity. CRM next-step capture. Follow-up discipline after inbound. Quality of qualification fields. These are the numbers managers can inspect weekly.
Many organizations overcorrect into pure activity tracking. That's a mistake. Behavior metrics should describe actions that matter inside the team's actual sales motion, not generic busyness.
Proficiency is the earliest signal and the most ignored
Structured assessment matters here. Research on sales training evaluation still points to a multi-level model that separates reaction, learning, behavior, and results, which is why completion rates and post-session satisfaction shouldn't stand in for effectiveness according to this research review on sales training evaluation.
Selection research also supports standardized assessment. A large 2026 study across more than 3,000 salespeople found that assessment scores explained 5.7% of the variance in on-the-job performance, and all measured competency groups were statistically significant predictors in this criterion-validity study on salesperson assessment.
That matters because proficiency shows up before pipeline does. If a rep consistently scores poorly on discovery depth, objection handling, or next-step control, a manager shouldn't wait for two quarters of weak conversion to act.
- Result layer: Use it to confirm whether the rep is winning enough.
- Behavior layer: Use it to inspect whether the rep is executing the expected motion.
- Proficiency layer: Use it to test whether the rep can perform the skill in a controlled scenario.
One option in that last layer is Overvue's sales skills assessment approach, which uses AI buyer simulations and standardized scoring to evaluate observable selling behavior. Teams that want a broader management lens can also pull from the HubEngage performance guide when formalizing how coaching, feedback, and measurement work together.
Why Averages Hide Risk and How to Read the Distribution
Average performance is comforting. It's also one of the fastest ways to miss structural risk.
A sales team can post an acceptable average quota attainment while most reps are underwater. That isn't a reporting issue. It's a concentration issue, and concentrated performance is fragile.
The mean can flatter a team that isn't healthy
When a small set of top sellers carries the quarter, team averages stop describing the actual motion. They describe the outcome of a few outliers. That's why leaders should review attainment spread, rep quartiles, stage conversion by cohort, and the share of reps below a meaningful floor.
High-variance teams need median and distribution reads far more than simple average reads.
Leadership read: If the same few names rescue every quarter, the team doesn't have depth. It has dependency.
Read the portfolio, not just the scoreboard
A better habit is to treat the sales floor the way an investor reads a portfolio. Leaders should look for concentration, volatility, and downside exposure.
Useful distribution questions include:
- Bottom-tail risk: How many reps are consistently far below plan?
- Top concentration: How much output comes from the top cohort?
- Cycle spread: Are weaker reps taking dramatically longer to close similar deals?
- Segment skew: Is one region or motion carrying numbers that hide failure elsewhere?
When those reads move in the wrong direction, averages become camouflage.
Averages Versus Distribution and What Each Number Actually Says
| Read | Average | Median | Distribution |
|---|---|---|---|
| Quota attainment | Shows overall team outcome | Shows the typical rep outcome in a small or uneven team | Shows whether only a few reps are carrying the number |
| Win rate | Gives a blended conversion view | Reduces outlier distortion | Shows whether weak and strong cohorts sell in completely different motions |
| Cycle length | Can be pulled around by very long or very short deals | Better for skewed cycle data | Shows whether certain reps or segments create recurring delay |
| Deal size | Summarizes revenue value per win | Can reflect the middle of the mix more accurately | Shows whether a few large deals are masking value erosion elsewhere |
A median can also mislead if most reps are clustered near the middle while one segment collapses. That's why leaders should inspect the spread itself, not just pick a better summary statistic.
The safest rule is simple. If the team number looks fine but the forecast still feels unstable, the distribution is probably telling the truth that the average is hiding.
Turning Metrics Into a Repeatable Coaching Cadence
Most sales organizations don't fail because they lack reports. They fail because nobody turns the reports into a fixed operating rhythm.
A disciplined cadence should run on four steps: measure, diagnose, coach, and re-measure. Not occasionally. Every quarter, with weekly inspection inside the quarter. Anything looser turns sales performance metrics into commentary.
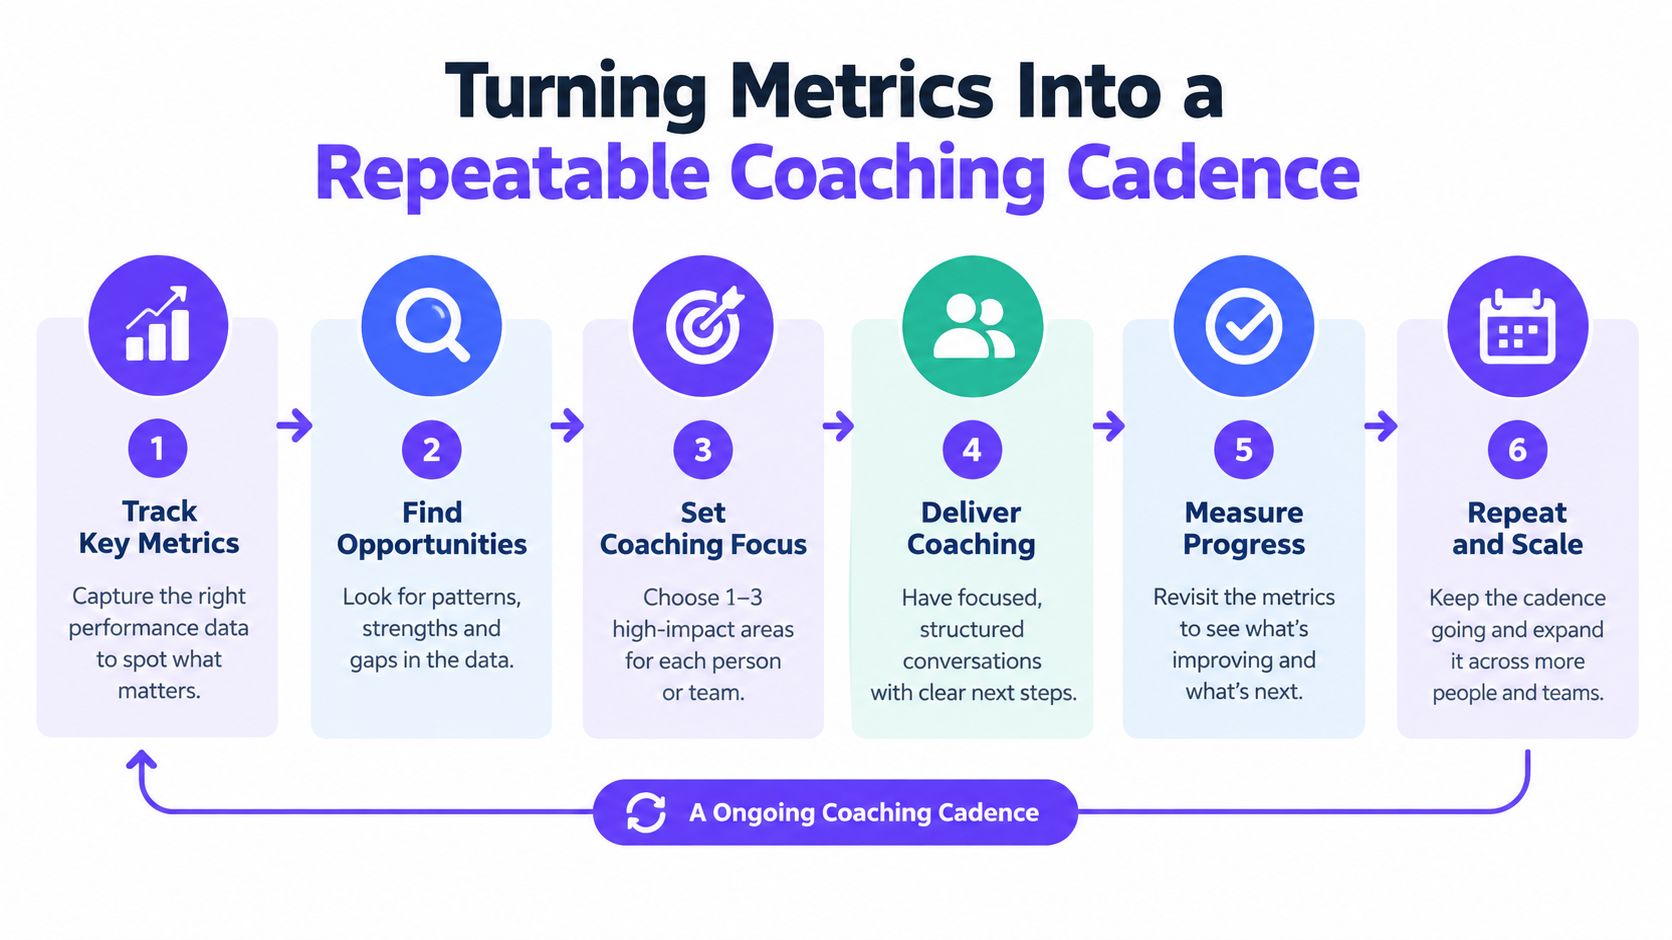
Measure with one source of truth
This is the unglamorous part, and it decides whether the rest works. Many teams still aren't even at basic measurement maturity. In one 2026 SMB study, 79% of respondents said they had not created any sales metrics, and 59% said they did not have a database of existing and prospective customers, according to the SalesXceleration SMB study.
That means a lot of teams shouldn't be debating advanced benchmarking yet. They should be fixing CRM hygiene, opportunity definitions, and ownership rules first.
Diagnose by mapping variance to a cause
Every metric family should answer one operational question.
- Quantity metrics: Is the team reaching enough of the right buyers?
- Quality metrics: Is the pipeline strong enough to convert?
- Efficiency metrics: Where is time leaking out of deals?
- Productivity metrics: Are outputs high enough relative to rep capacity?
The mistake here is jumping from a bad number to generic pressure. Leaders should force one root-cause statement before prescribing any action.
Coach the behavior, not the symptom
A manager shouldn't tell a rep to “improve win rate.” That's not coaching. Coaching means assigning a concrete behavior tied to the variance. Tighten qualification criteria. Improve next-step language. Run deal reviews on stage exits. Rehearse procurement handling. Inspect multi-threading on late-stage enterprise deals.
Good coaching always sounds operational, not motivational.
Re-measure on a short loop
The metric review needs a follow-up date. Usually that means checking whether the targeted behavior changed first, then whether the output moved after. If nothing changes, the diagnosis was wrong or the coaching wasn't specific enough.
This cadence also improves forecast discipline because it replaces opinion with repeated inspection. Teams that run it consistently build cleaner stage definitions, better manager judgment, and fewer surprise misses.
Overvue helps sales teams turn vague coaching into observed evidence by simulating buyer conversations, scoring reps against consistent criteria, and making skill gaps visible before they show up in pipeline results. For leaders trying to connect sales performance metrics to hiring, onboarding, and rep development, that's a practical way to add a proficiency layer to the operating cadence. Learn more at Overvue.